A quantitative analysis
Six months to go: The Solvency II Review is coming into force
On 30 January 2027, the revised Solvency II framework will become applicable – bringing significant changes for insurers across Europe, and a lot of quantitative changes for actuaries and risk managers to take into account!
Across 120 analysed tables in the review, 28 (23.3%) show either differences or are new in the regulation. From the 27,341 changed entries NatCat related matrices make up the main part, the other differences are stemming mainly from market risk modules.
All tables are available by us, get in touch with us if you want to use them for your own validation!
Summary
Measure | NatCat | Others | Combined |
Analysed SII Review Tables | 77 | 43 | 120 |
Tables with differences / new | 18 | 10 | 28 |
Change proportion | 23.4% | 23.3% | 23.3% |
Changed / new entries | 26,935 | 406 | 27,341 |
What merits immediate attention
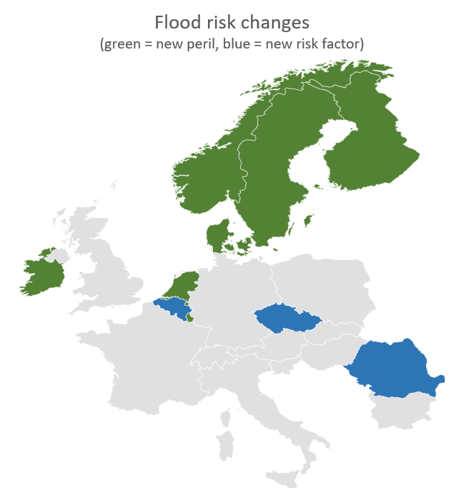
- NatCat: Geographic expansion: 10 tables exist only in the Solvency II Review, including flood matrices for six countries, hail for Poland, and a new subsidence module.
- RO: Romania remapping: earthquake and flood country matrices expand from 42×42 to 48×48, while the regional earthquake factor falls 41.2% and the flood factor falls 56.7%.
- Market: Market and spread calibration: interest-rate shock structures are re-specified; STS and other securitization risk factors generally decrease; the market correlation matrix changes.
- MCR factors: 11 of 32 numeric α/β factors change across 7 of 16 segments, with both upward and downward revisions
NatCat comparison
Coverage and concentration
18 of 77 catastrophe tables differ. Of 26,935 changed entries, 26,576 (98.7%) are country matrices. Four items account for 90.3% of catastrophe changed entries.
| Change driver | Entries | Structural reading |
| Poland hail matrix — new | 10,000 | 100×100 matrix introduced |
| Netherlands flood matrix — new | 8,281 | 91×91 matrix introduced |
| Romania earthquake matrix | 2,304 | 42×42 → 48×48 plus coefficient changes |
| Romania flood matrix | 2,304 | 42×42 → 48×48 plus coefficient changes |
| All other cat changes | 2,616 | New matrices, factors and regional correlations |
Newly represented catastrophe scope
| Peril | New in the Solvency II Scope | Matrix cells |
| Flood | Ireland, Denmark, Finland, Sweden, Netherlands, Norway, Luxembourg | 10,438 |
| Hail | Poland | 10,000 |
| Subsidence | Belgium country matrix + region risk factor/correlation table | 118 |
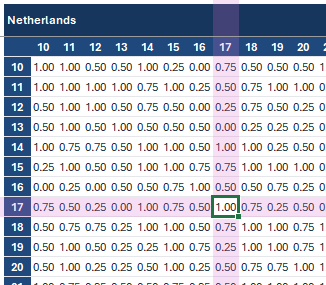
All processed tables have the following form and can be delivered by us:
The flood risk was specifically reworked across Europe as can be seen on the following map:
Market comparison
Changes to the Market Risk Modules
Overall, 10 of 43 regulatory tables will differ. Parameter and lookup tables contribute 390 of 406 changed cells (96.1%); 260 cells come from the two interest-rate shock tables alone.
| Area | Quantitative observation | Potential model implication |
| Interest-rate shocks | Rows expand from 22 to 51 in both up/down tables; 130 changed cells each. | Rebuild full maturity curve; do not extrapolate the old 20/90-year structure. |
| Senior STS | 56 changed cells; coefficients generally lower. | Recalculate spread SCR by CQS and duration; check caps/formula changes. |
| Non-senior STS | 45 changed cells | Recalculate tranche-level spread stress. |
| Other senior securitisation | 6 of 7 b coefficients change | Potentially material reduction, subject to classification and formula interpretation. |
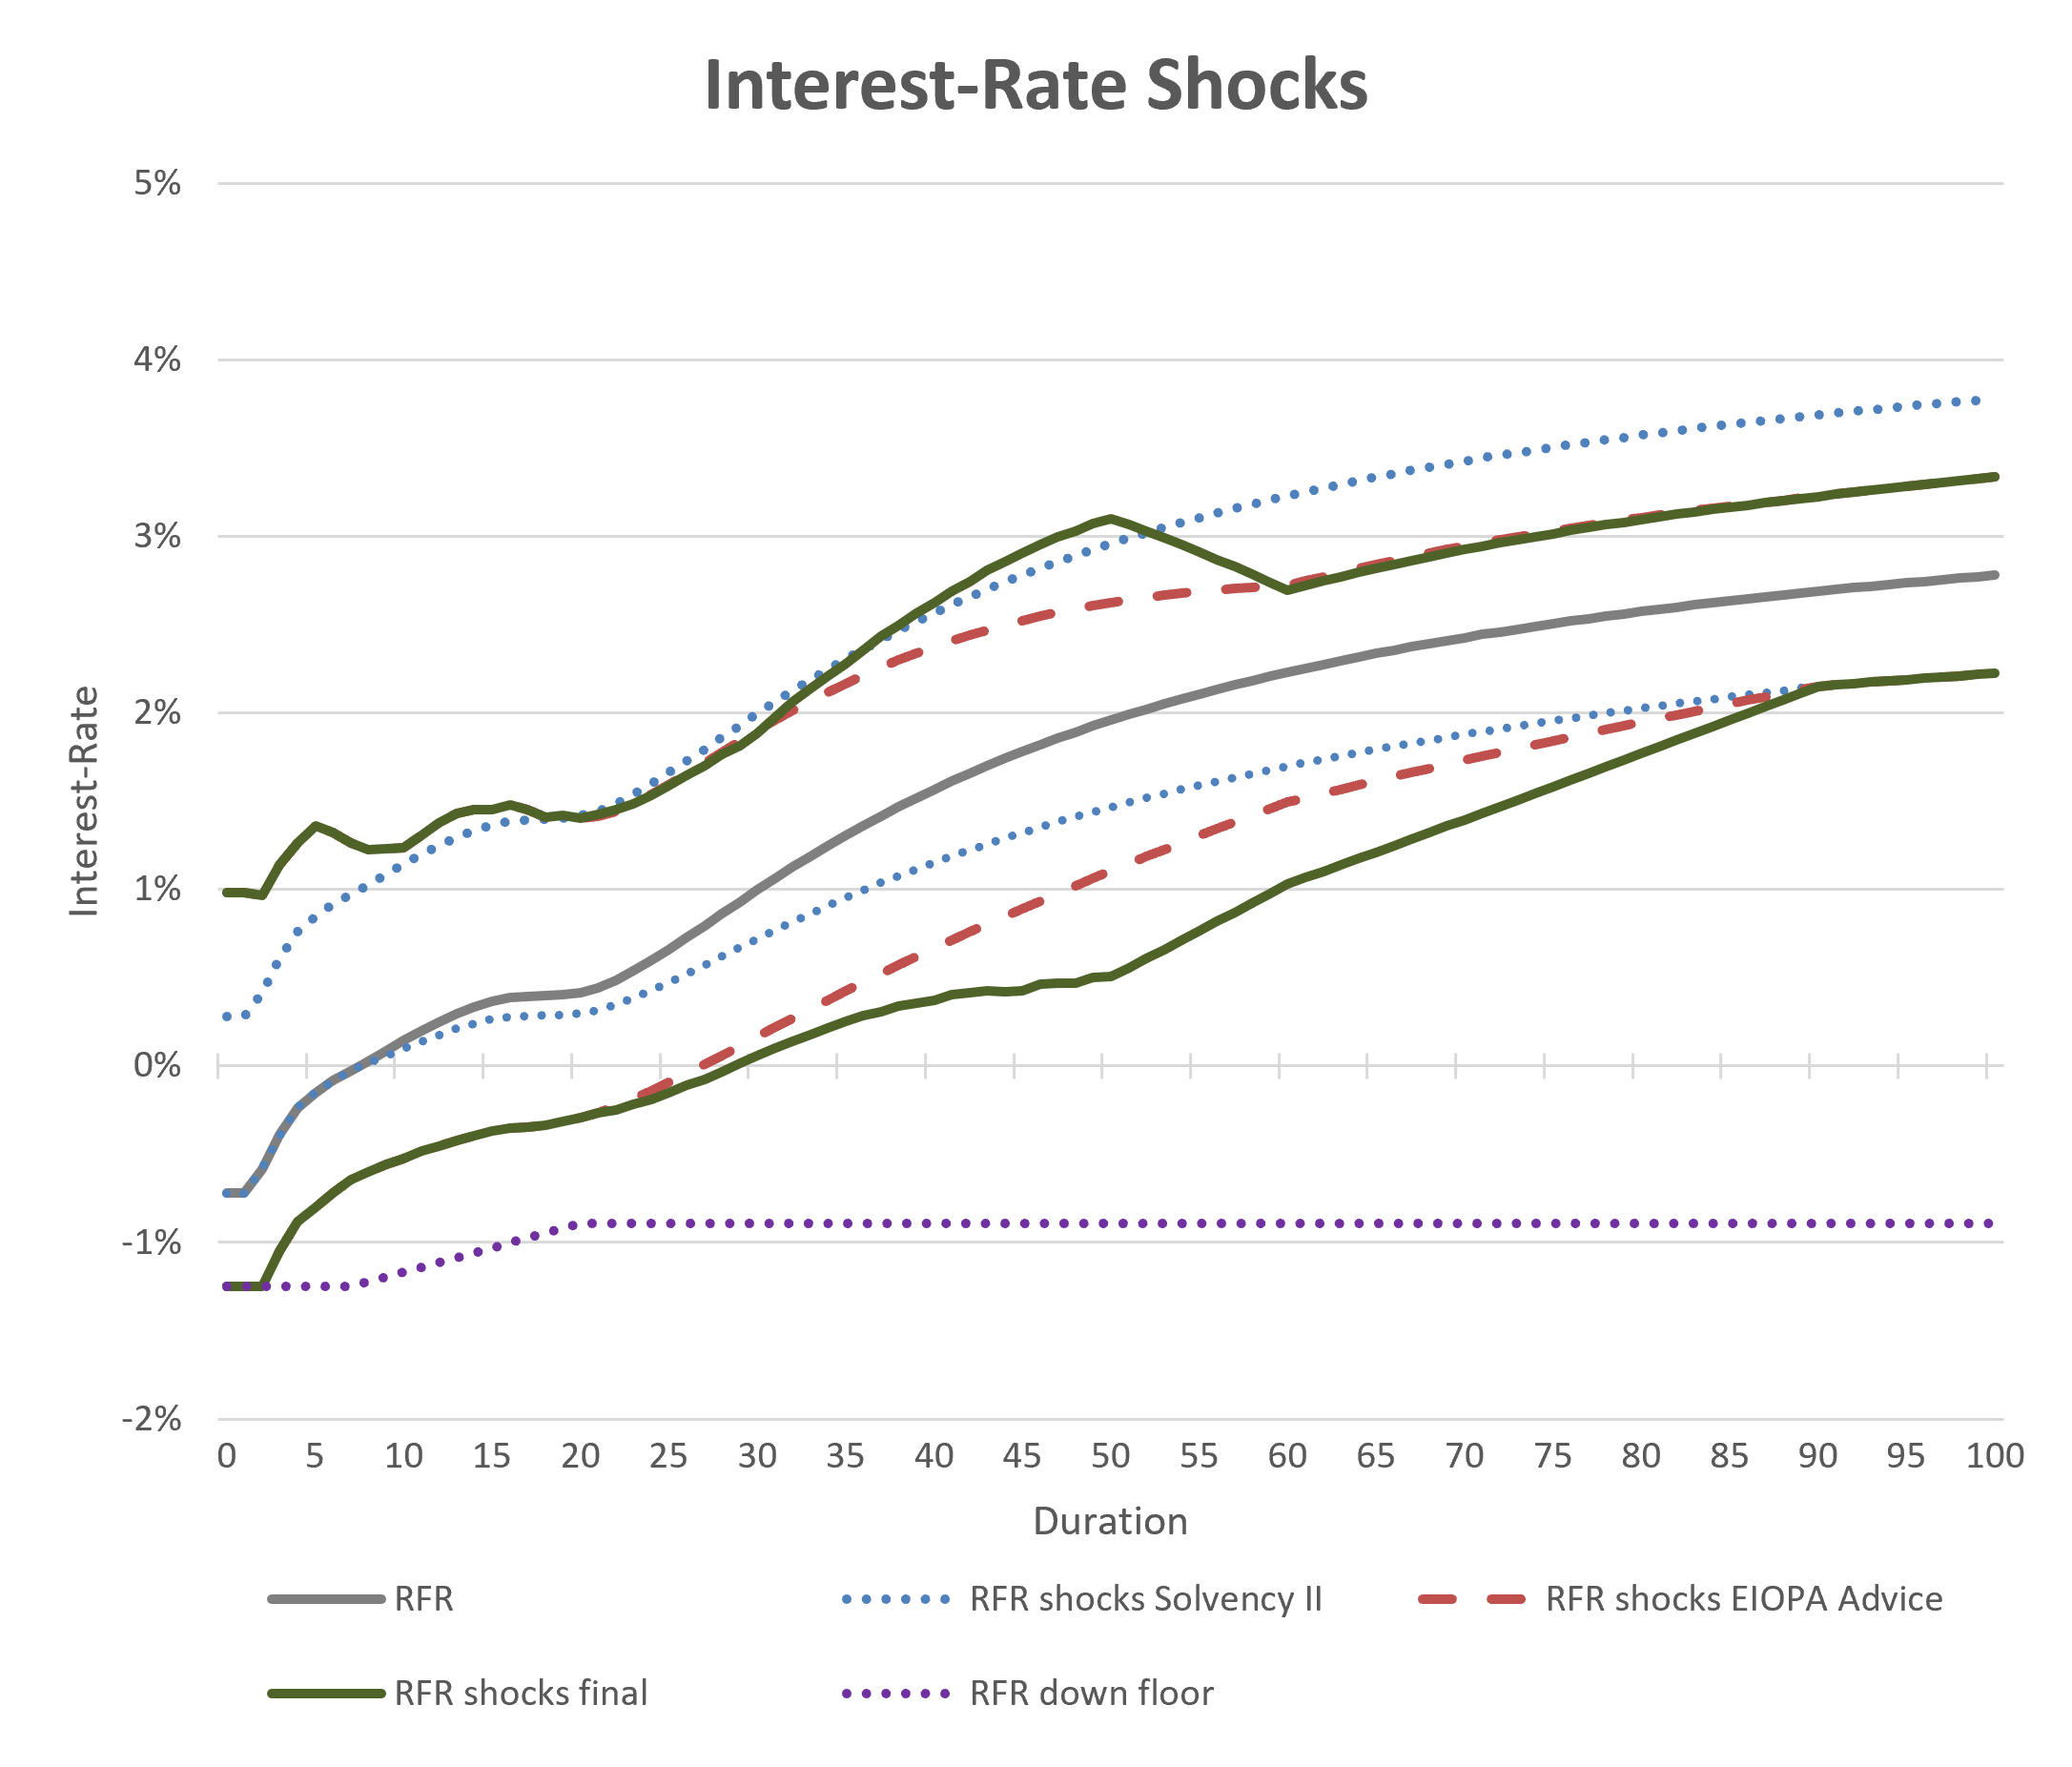
While the securitisation rework focused mainly on parameter changes, the interest-rate risk as well as the construction of the risk-free interest rate term structure will change.
The following graphic shows the development on an example interest-rate of the shocks from the initial Solvency II via the EIOPA Advice to the final Review Delegated Regulation, without taking into account the FSP. Note that depending on the FSP (First Smoothing Point) the extrapolation towards a shocked UFR (Ultimate Forward Rate) starts.
MCR factor changes
The following table represents the MCR factor changes (α for technical provisions, β for premiums written) coming with the Solvency II Review for alpha and beta, not mentioned segments stay unchanged:
Segment | Solvency II | Review | Relative change | |||
Factor | α | β | α | β | α | β |
Medical expense | 4.7% |
| 5.4% |
| 14.9% |
|
Income protection |
| 8.5% |
| 8.0% |
| -5.9% |
Workers’ compensation | 10.7% | 7.5% | 10.3% | 9.0% | -3.7% | 20.0% |
Credit & suretyship | 17.7% | 11.3% | 16.0% | 17.7% | -9.6% | 56.6% |
Legal expenses | 11.3% | 6.6% | 5.2% | 7.8% | -54.0% | 18.2% |
Assistance | 18.6% | 8.5% | 20.3% | 6.0% | 9.1% | -29.4% |
Non-proportional health reinsurance | 18.6% |
| 15.9% |
| -14.5% |
|